import numpy as np
import pandas as pd
import matplotlib.pyplot as plt
import seaborn as snsIII Categorical data
%%javascript
IPython.OutputArea.prototype._should_scroll = function(lines) {
    return false; // disable auto scrolling
}
# III Visualization of distributional data (“displot”)
penguins = sns.load_dataset("penguins")
penguins.head()| species | island | bill_length_mm | bill_depth_mm | flipper_length_mm | body_mass_g | sex | |
|---|---|---|---|---|---|---|---|
| 0 | Adelie | Torgersen | 39.1 | 18.7 | 181.0 | 3750.0 | Male |
| 1 | Adelie | Torgersen | 39.5 | 17.4 | 186.0 | 3800.0 | Female |
| 2 | Adelie | Torgersen | 40.3 | 18.0 | 195.0 | 3250.0 | Female |
| 3 | Adelie | Torgersen | NaN | NaN | NaN | NaN | NaN |
| 4 | Adelie | Torgersen | 36.7 | 19.3 | 193.0 | 3450.0 | Female |
tips = sns.load_dataset("tips")
tips.head()| total_bill | tip | sex | smoker | day | time | size | |
|---|---|---|---|---|---|---|---|
| 0 | 16.99 | 1.01 | Female | No | Sun | Dinner | 2 |
| 1 | 10.34 | 1.66 | Male | No | Sun | Dinner | 3 |
| 2 | 21.01 | 3.50 | Male | No | Sun | Dinner | 3 |
| 3 | 23.68 | 3.31 | Male | No | Sun | Dinner | 2 |
| 4 | 24.59 | 3.61 | Female | No | Sun | Dinner | 4 |
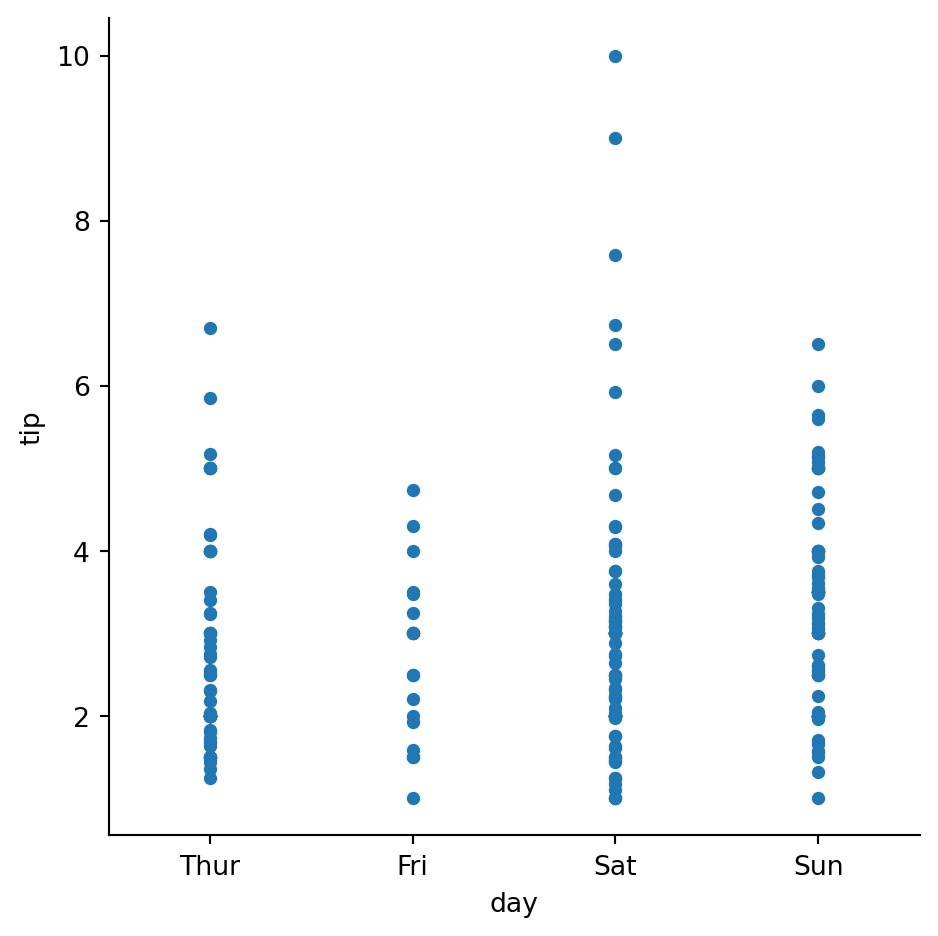
Categorical scatterplots
sns.catplot(data=tips,
            x="day",
            y="tip",
           # kind='strip' # default is 'strip'
           jitter=False # default is True
           )
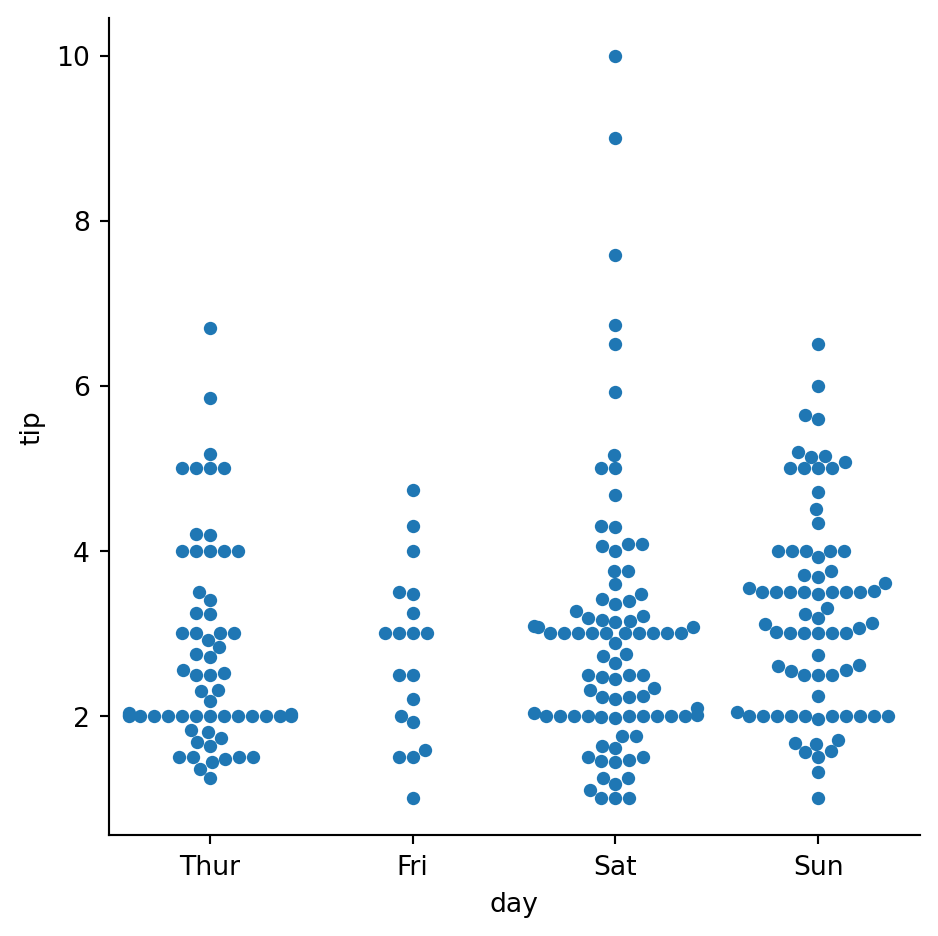
sns.catplot(data=tips,
            x="day",
            y="tip",
            kind="swarm")
/home/pierro/mambaforge/lib/python3.10/site-packages/seaborn/categorical.py:3544: UserWarning:
8.1% of the points cannot be placed; you may want to decrease the size of the markers or use stripplot.
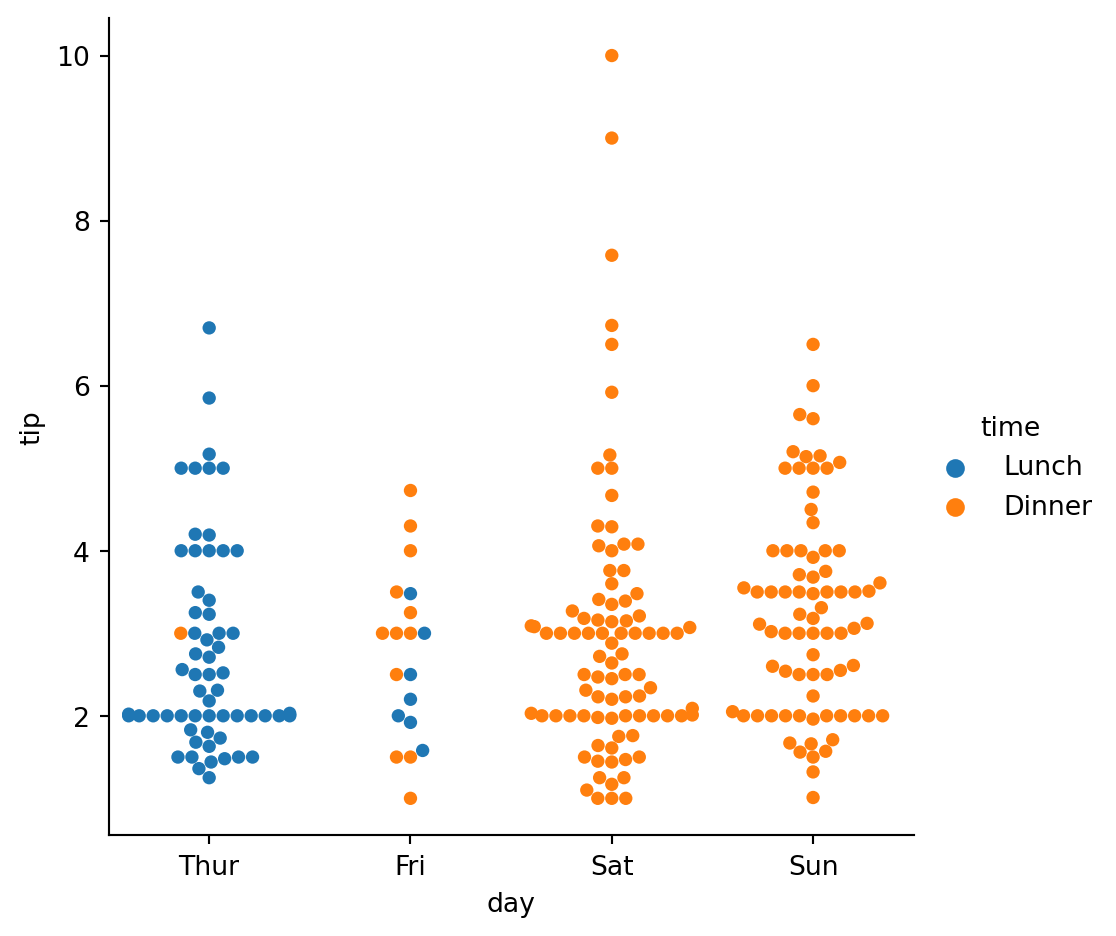
sns.catplot(data=tips,
            x="day",
            y="tip",
            hue="time",
            kind="swarm")
/home/pierro/mambaforge/lib/python3.10/site-packages/seaborn/categorical.py:3544: UserWarning:
8.1% of the points cannot be placed; you may want to decrease the size of the markers or use stripplot.
sns.catplot(data=tips,
            x="day",
            y="total_bill",
            hue="size",
            col='sex')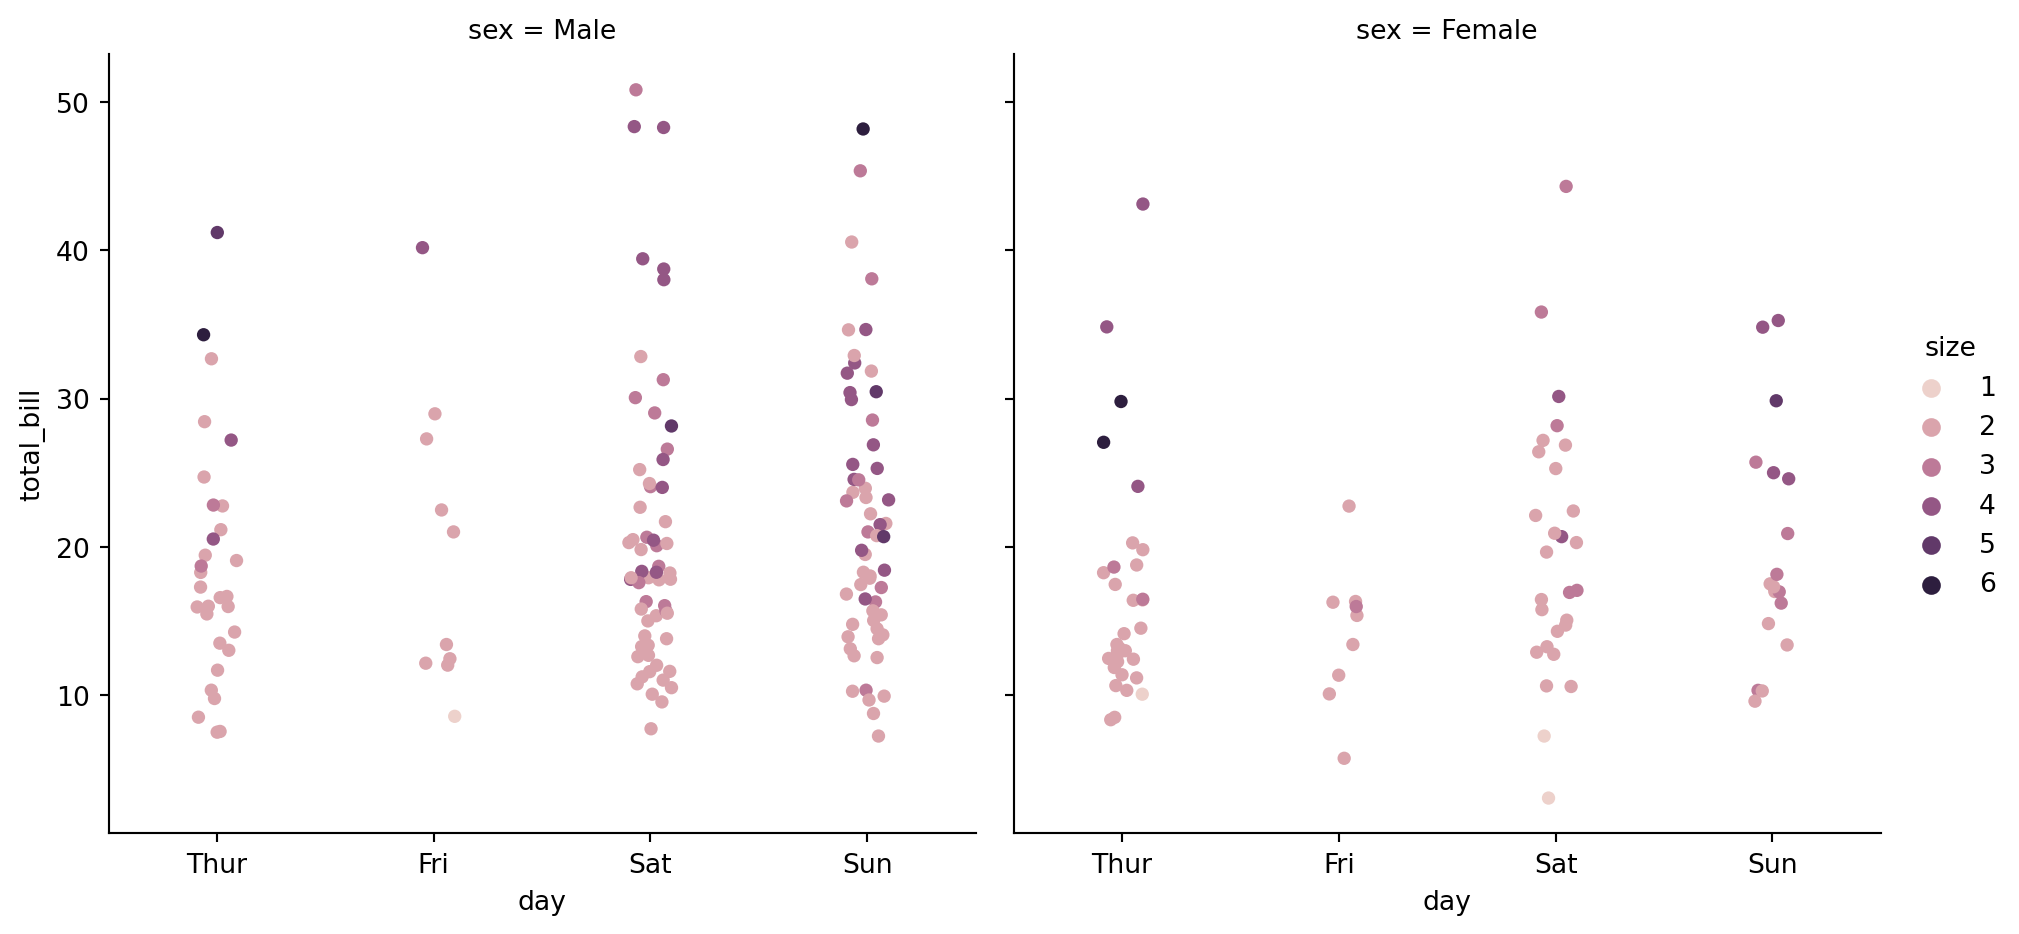
# Specify the ordering if the categorical values
sns.catplot(data=tips,
            x="day",
            y="tip",
            order=["Thur", "Fri","Sat","Sun"])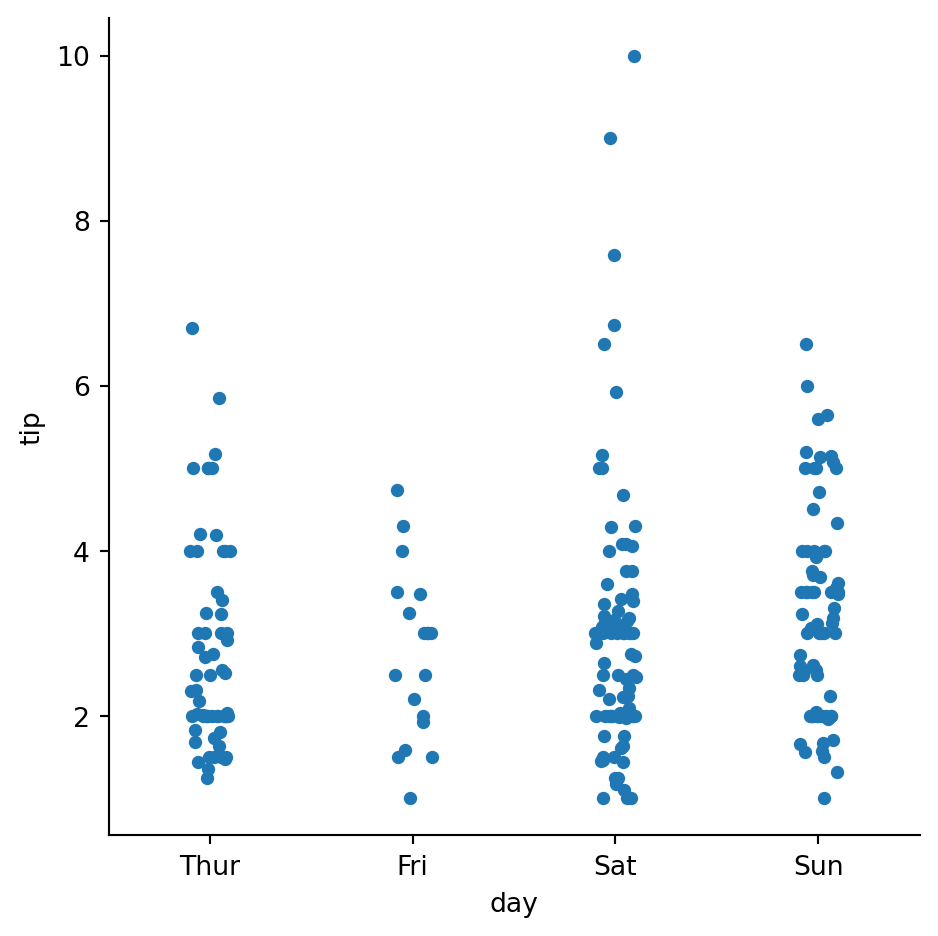
# Swapping orientation
sns.catplot(data=tips,
            x="total_bill",
            y="day",
            hue="time",
            col='sex')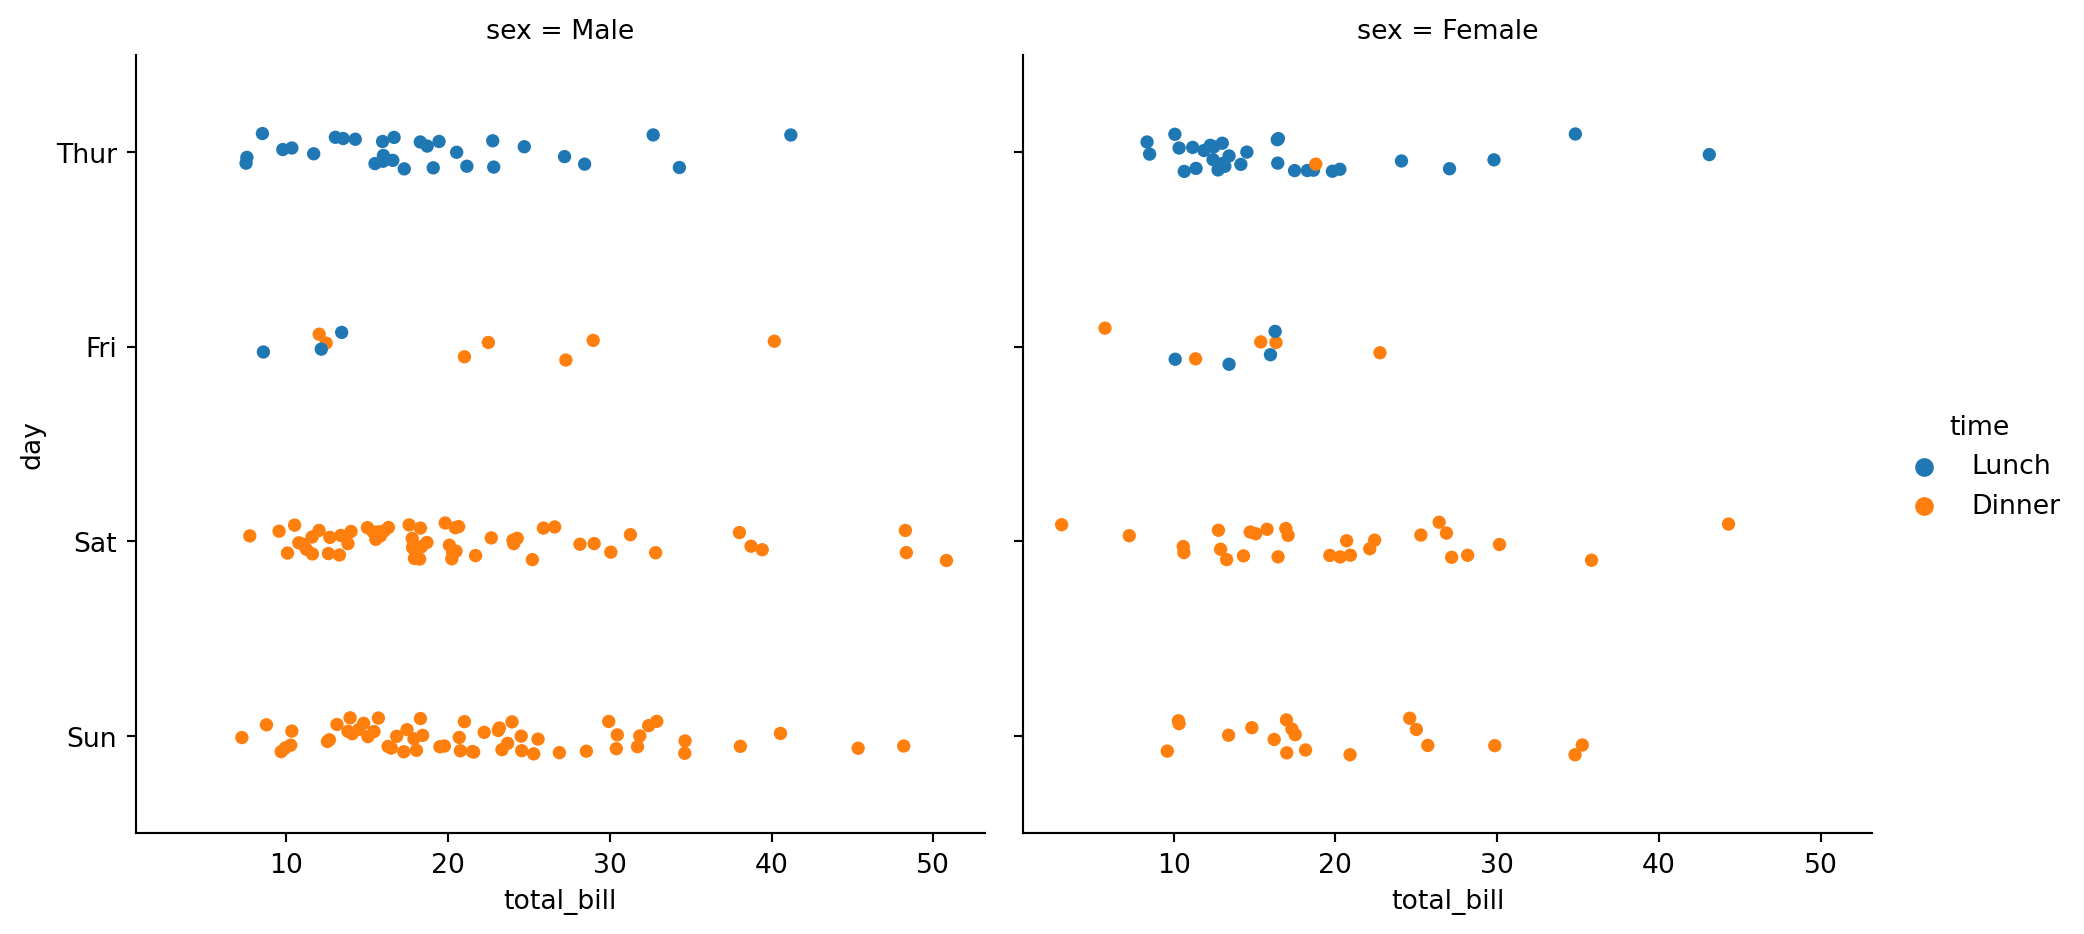
Comparing distributions along categoritcal variables (mean, median, quantiles)
Boxplot using kind='box'
sns.catplot(data=tips,
            x="day",
            y="total_bill",
            kind="box")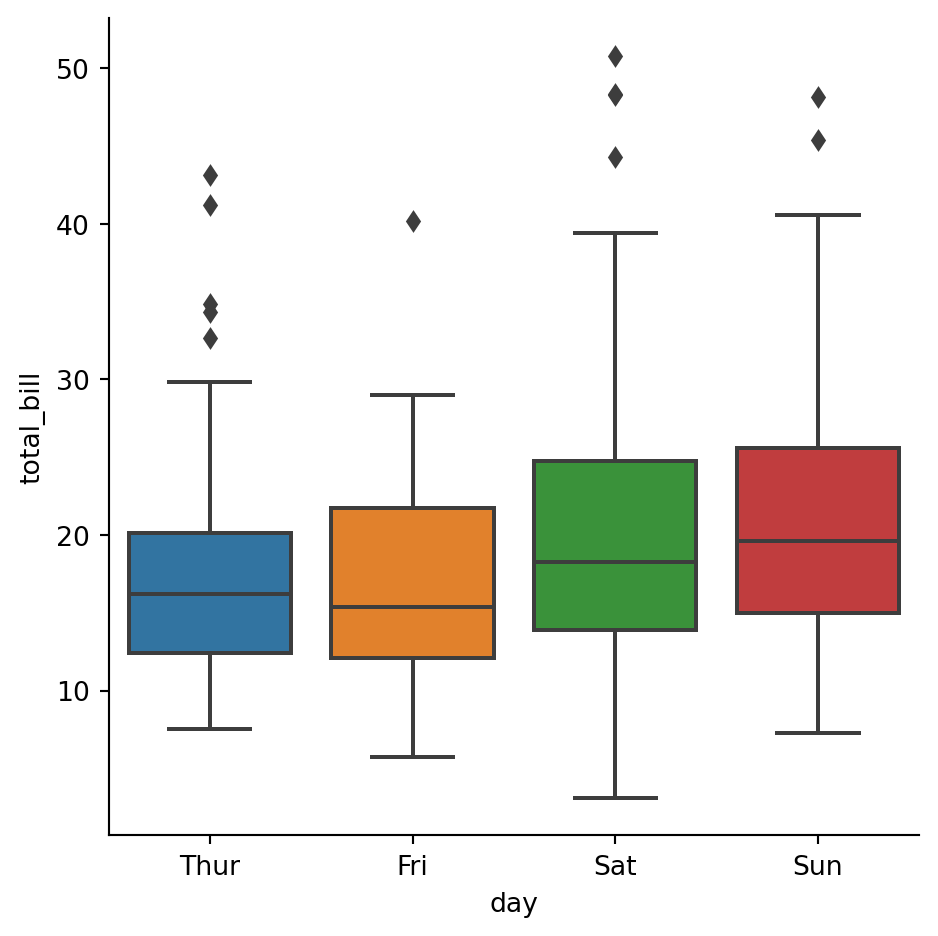
sns.catplot(data=tips,
            x="day",
            y="total_bill",
            hue="smoker",
            kind="box")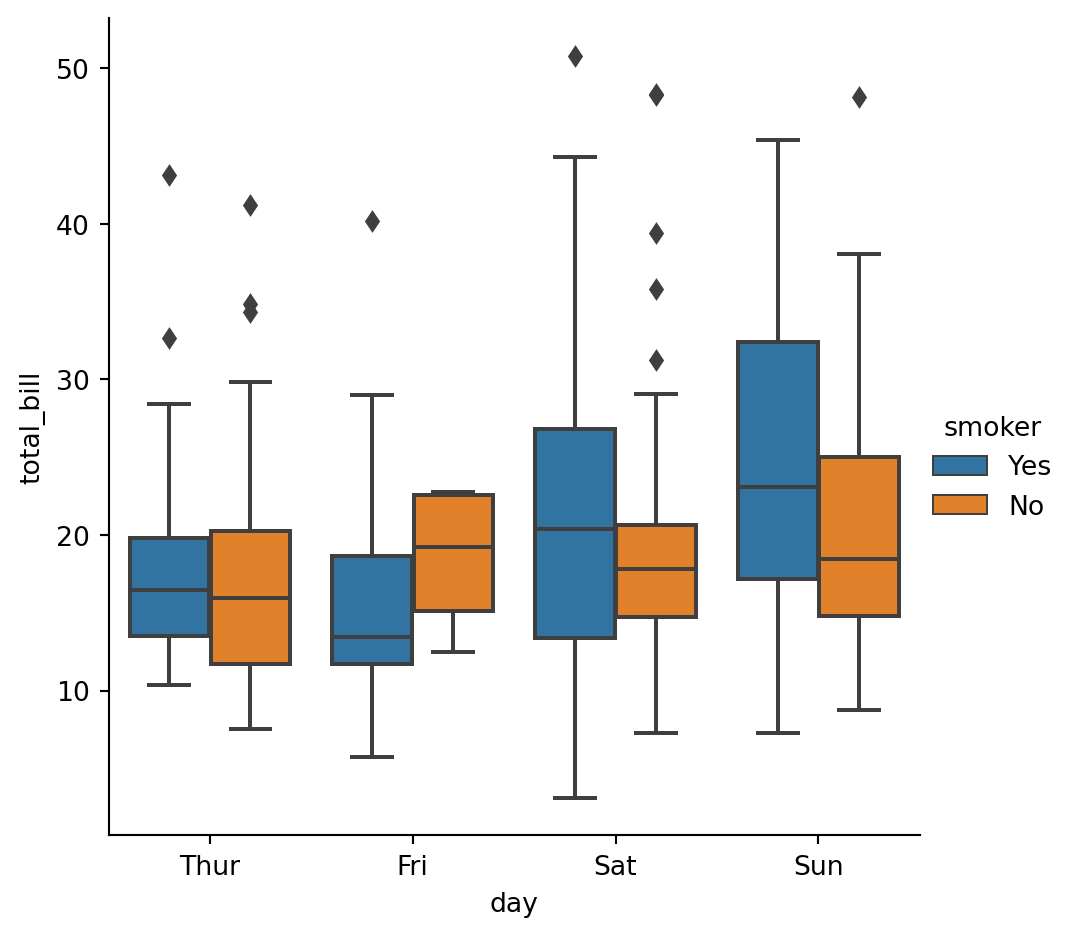
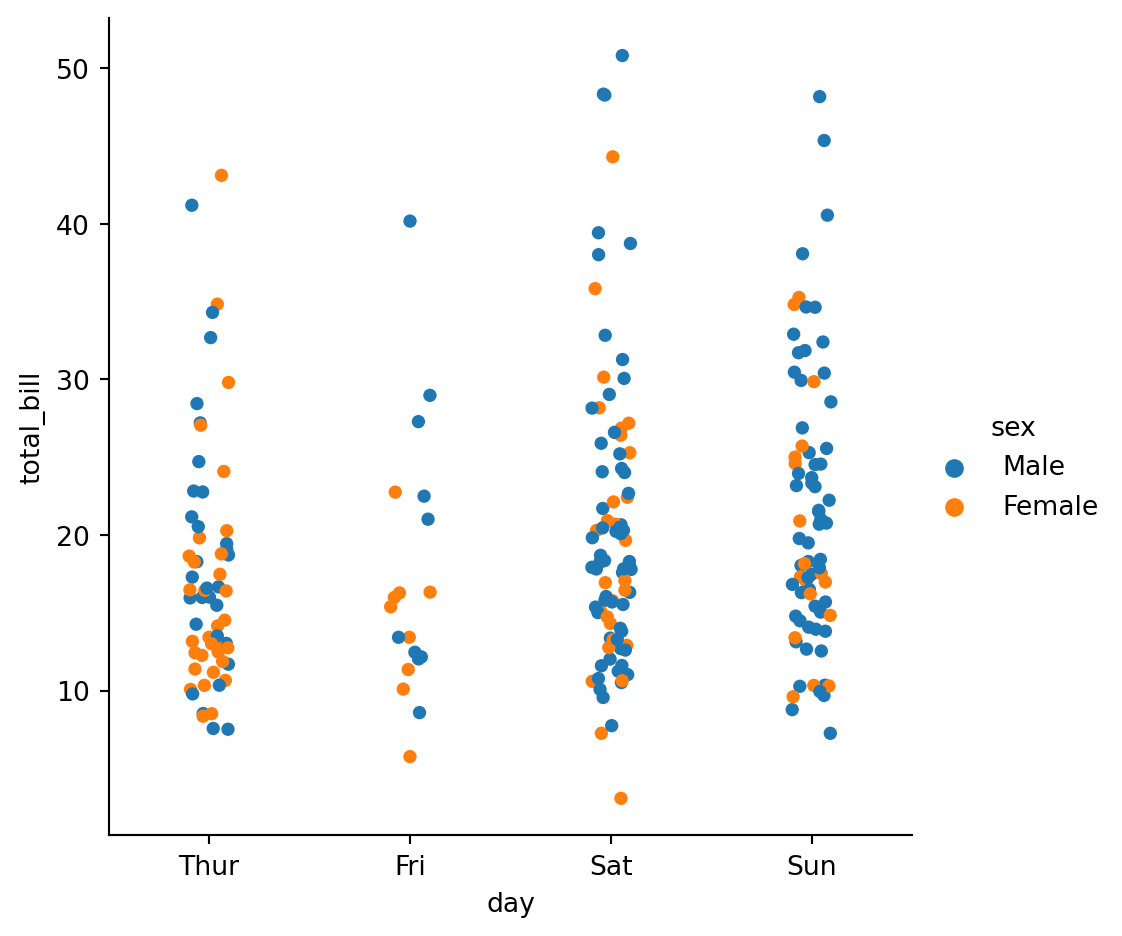
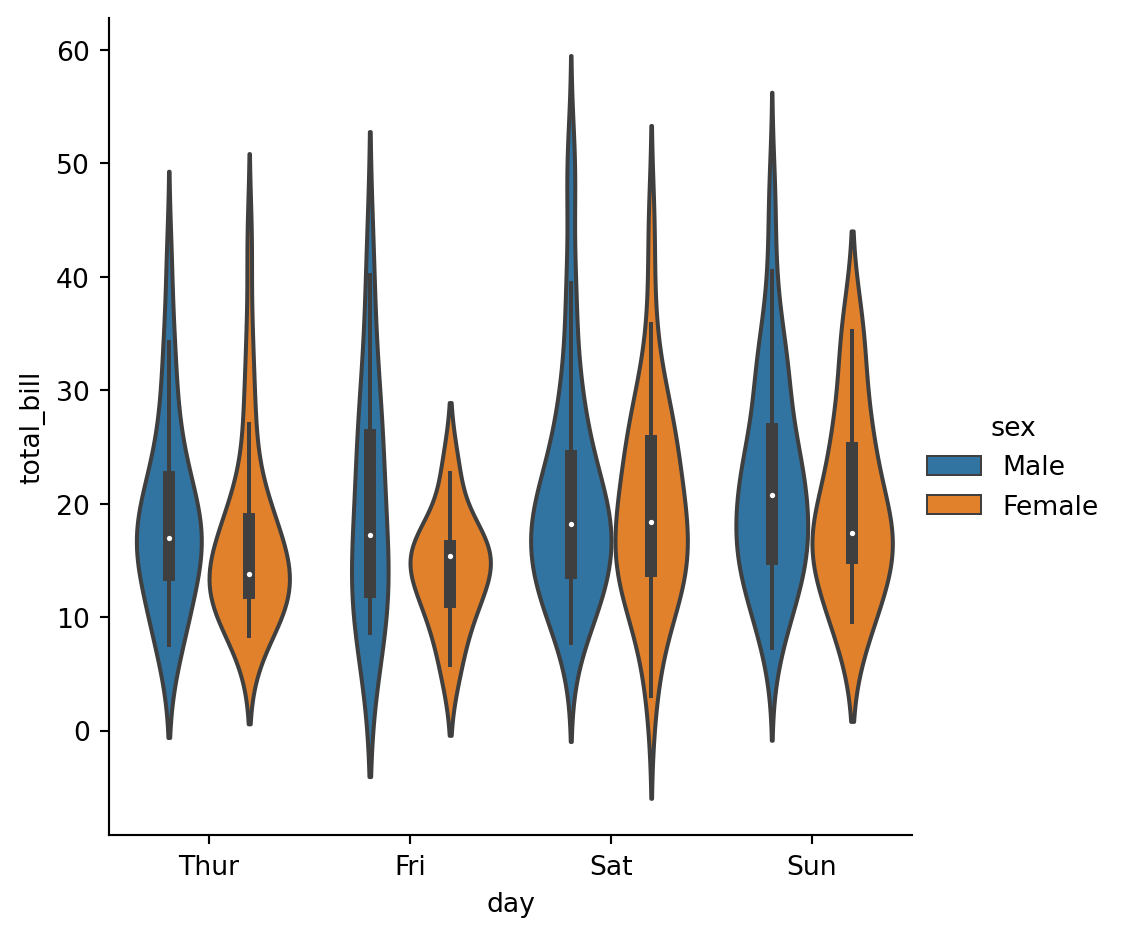
Violin plots with kind='violin'
sns.catplot(
    data=tips,
    x="day",
    y="total_bill",
    hue="sex"
)
sns.catplot(
    data=tips,
    x="day",
    y="total_bill",
    hue="sex",
    kind='violin'
)
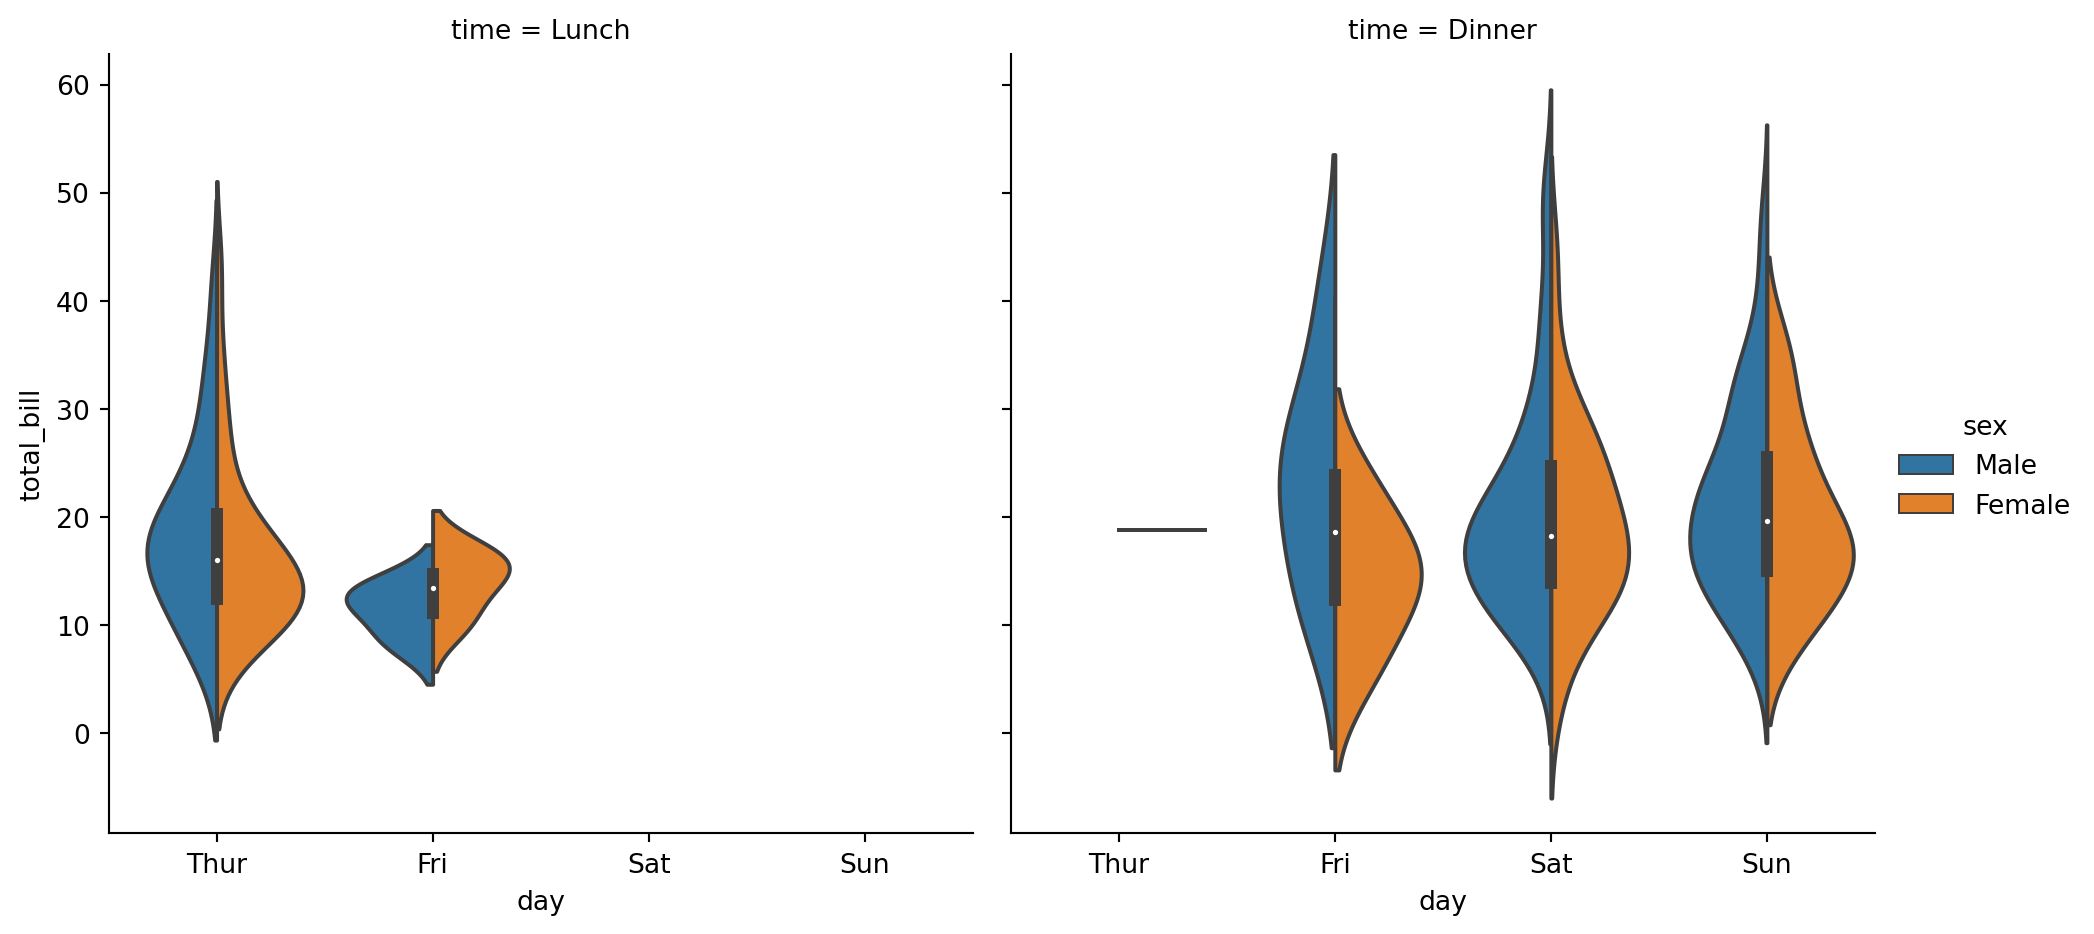
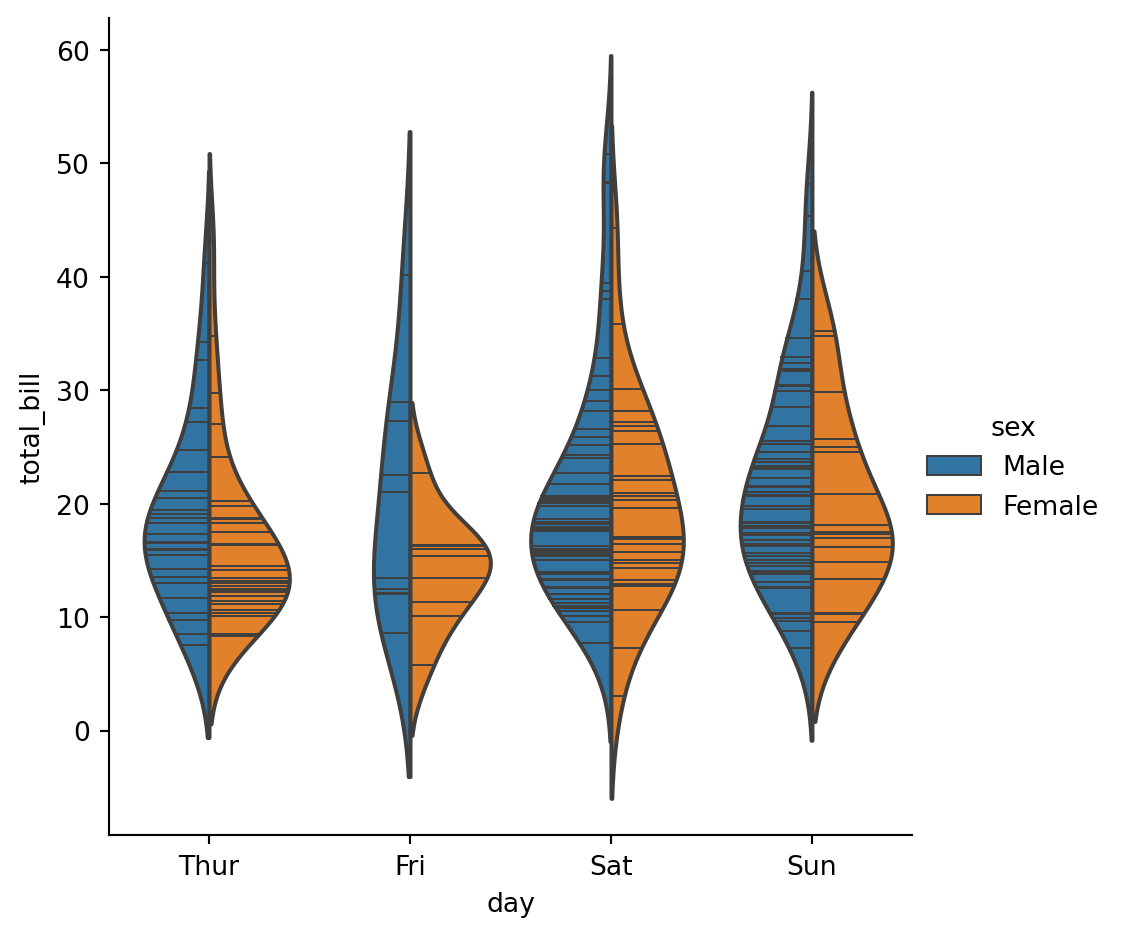
# have the two populations’ violin “stick” to each other with split=True'
sns.catplot(
    data=tips,
    x="day",
    y="total_bill",
    hue="sex",
    col='time',
    kind="violin",
    split=True,
)
sns.catplot(
    data=tips,
    x="day",
    y="total_bill",
    hue="sex",
    kind="violin",
    inner='stick',
    split=True,
)
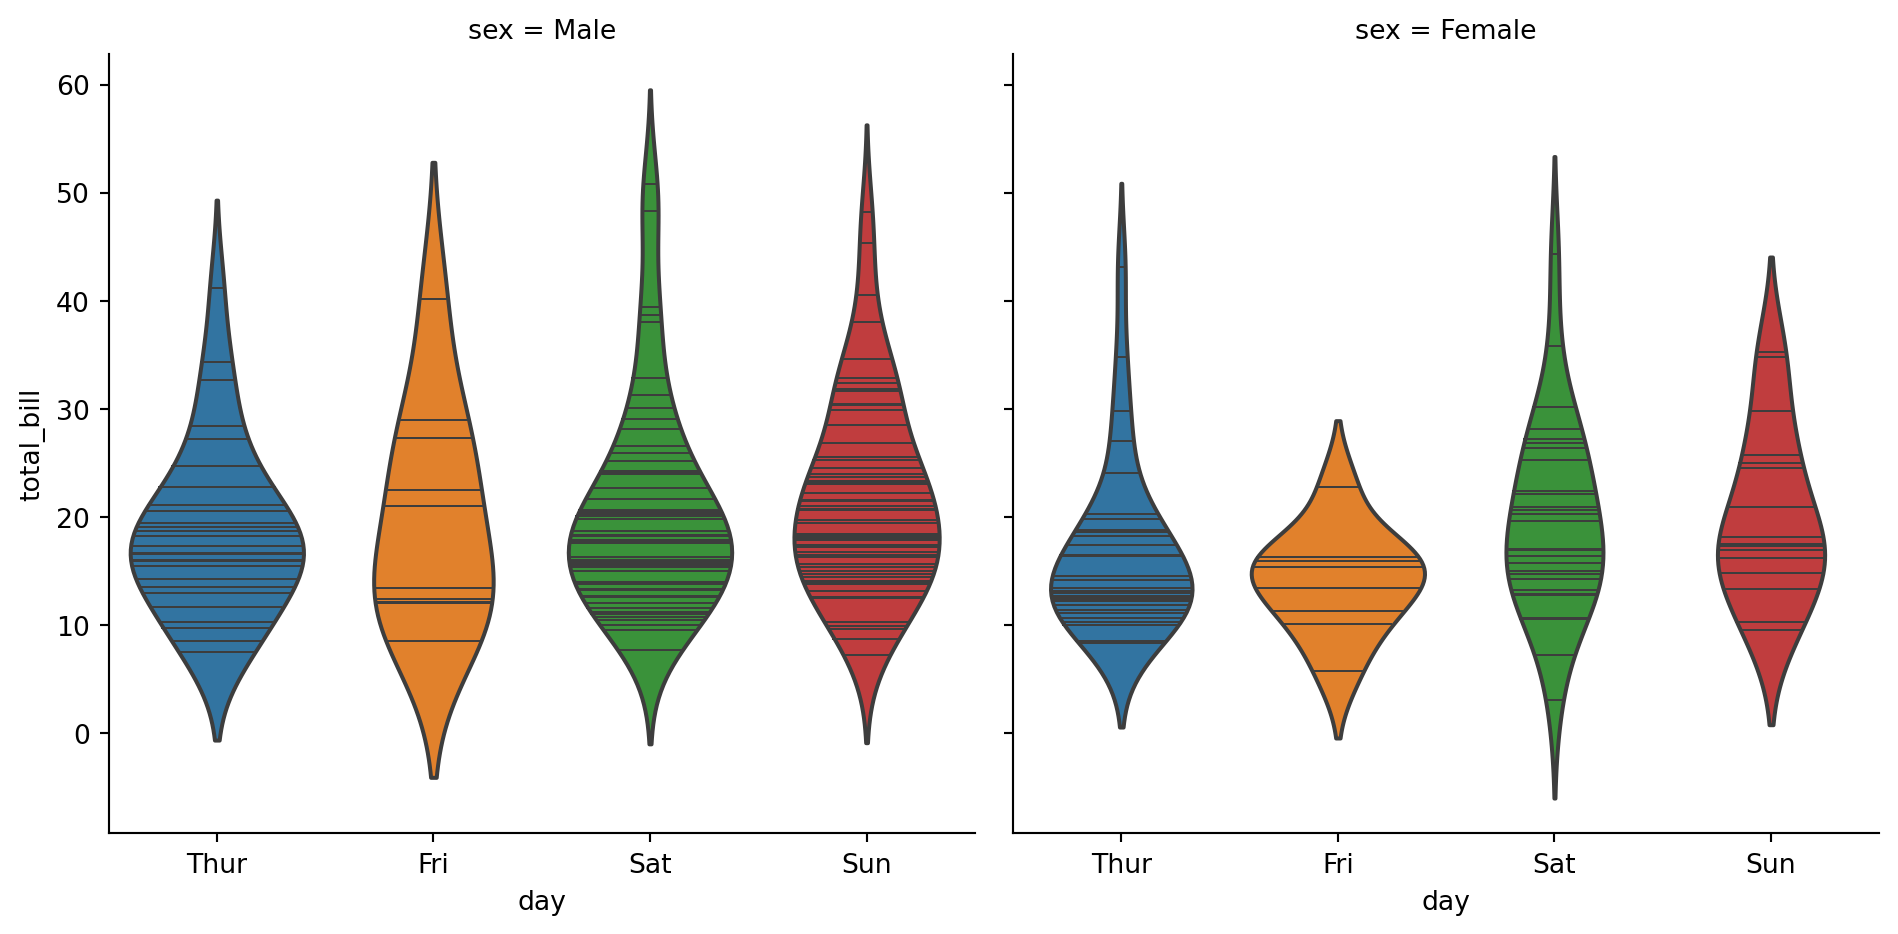
# Showing additional dimensions with col=(...) or row=(...)
sns.catplot(
    data=tips,
    x="day",
    y="total_bill",
    col="sex",
    kind="violin",
    inner='stick',
    split=True,
)
Bar plots
sns.catplot(data=tips,
            x="day",
            y="total_bill",
            hue="sex",
            kind="bar")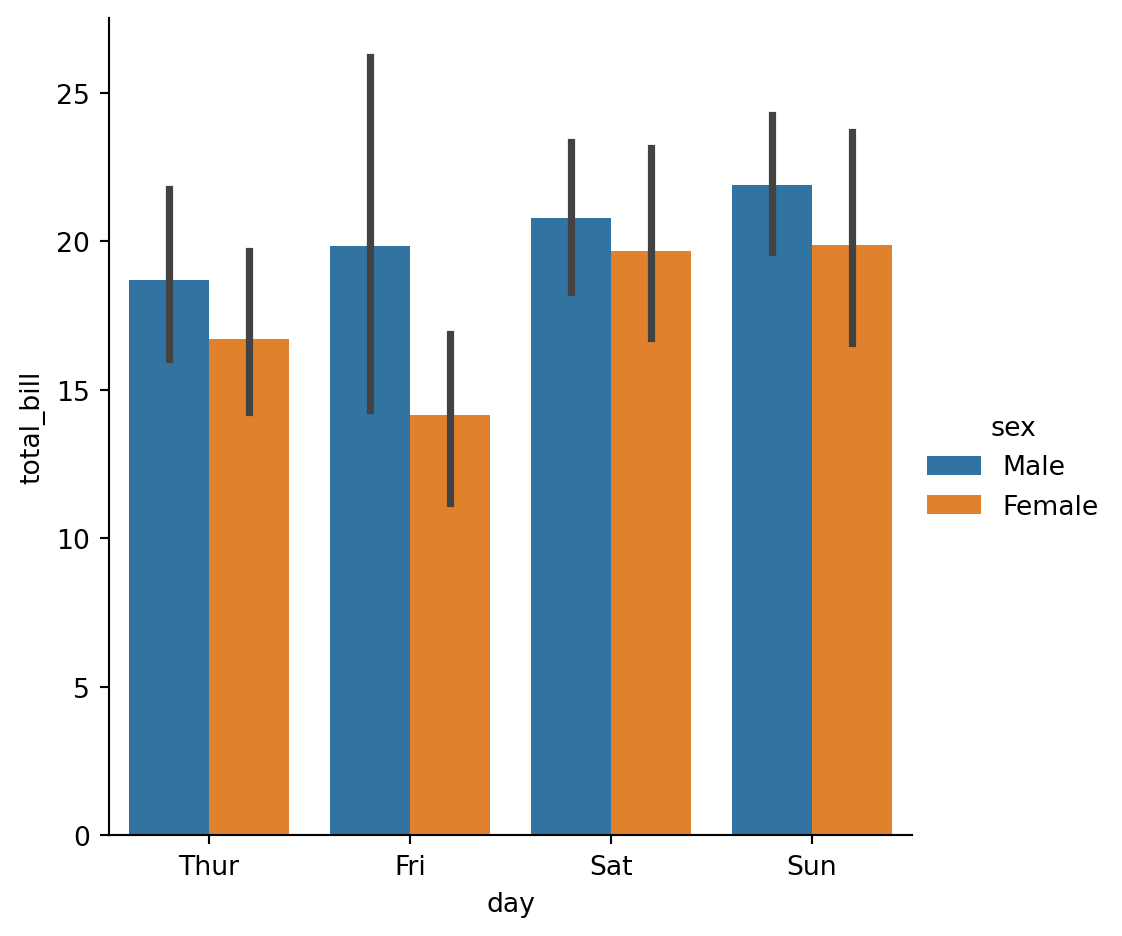
sns.catplot(data=tips,
            x="day",
            y="total_bill",
            hue="sex",
            kind="bar",
           errorbar="ci") # standard confidence interval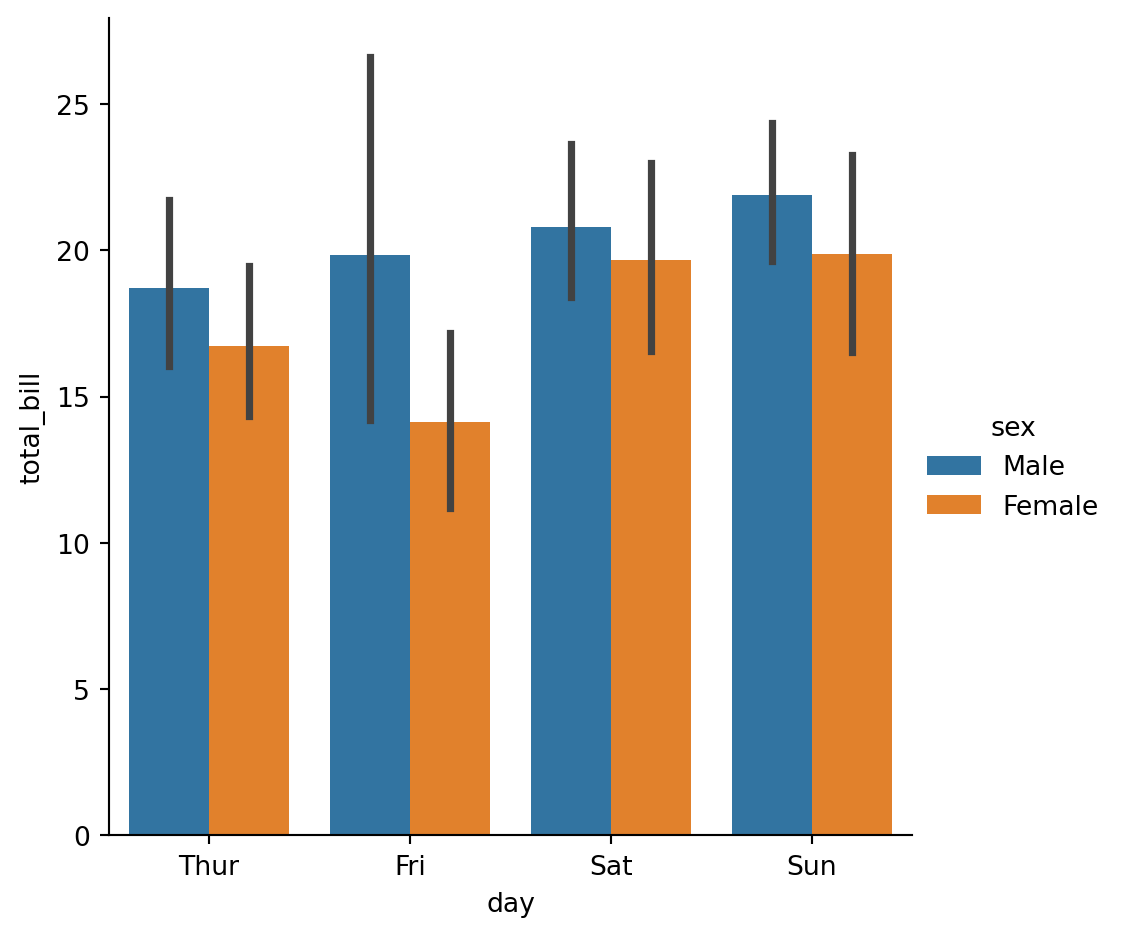
sns.catplot(data=tips,
            x="day",
            y="total_bill",
            hue="sex",
            kind="bar",
           errorbar='sd') # standard deviation 'sd'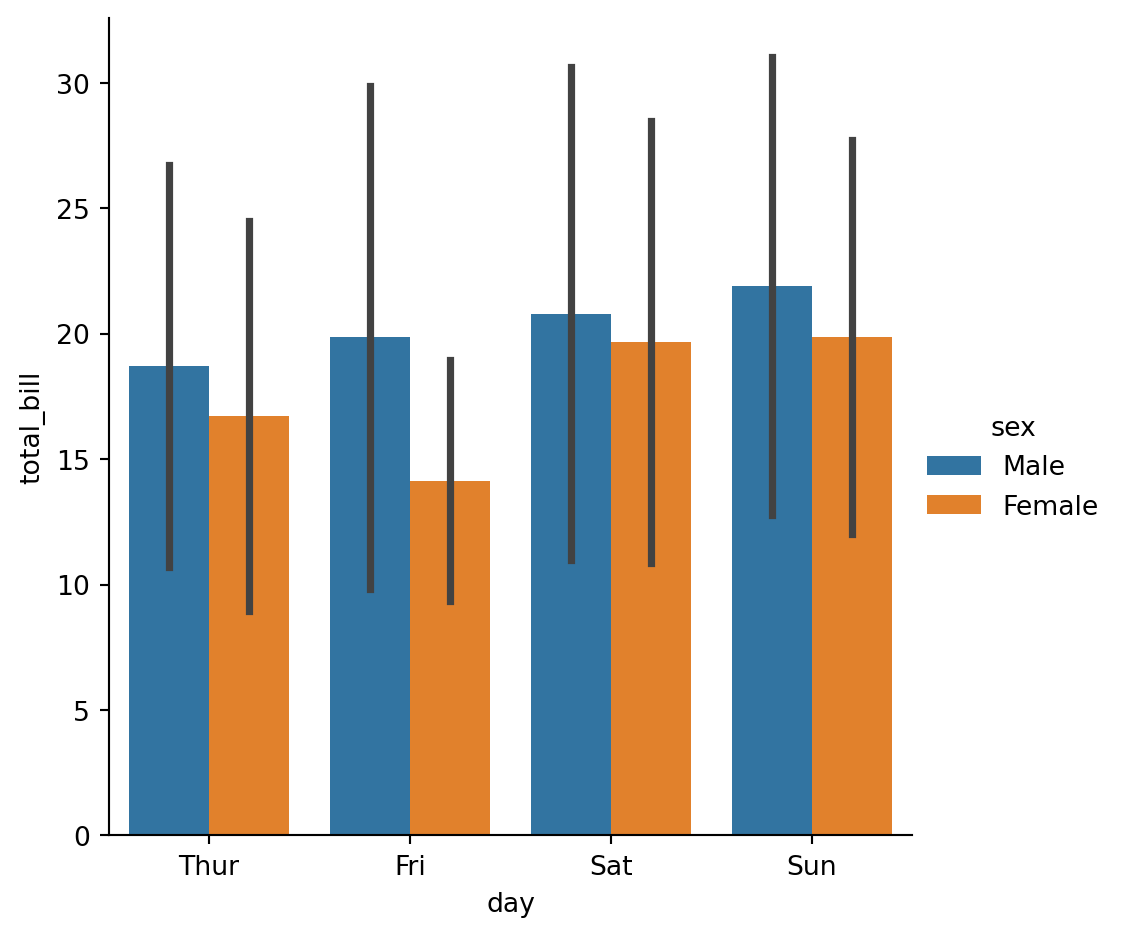
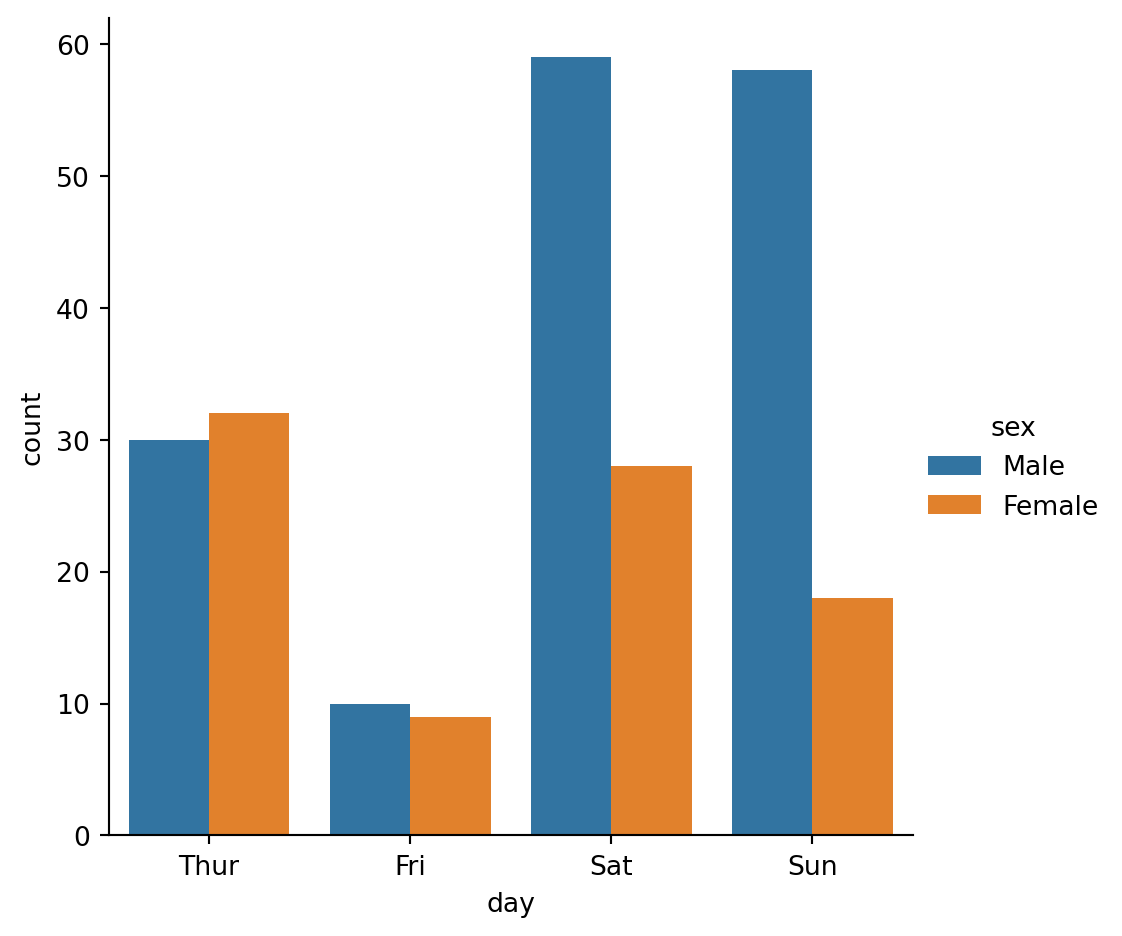
Counting data with kind='count'
sns.catplot(
    data=tips,
    x="day",
    hue="sex",
    kind="count"
)
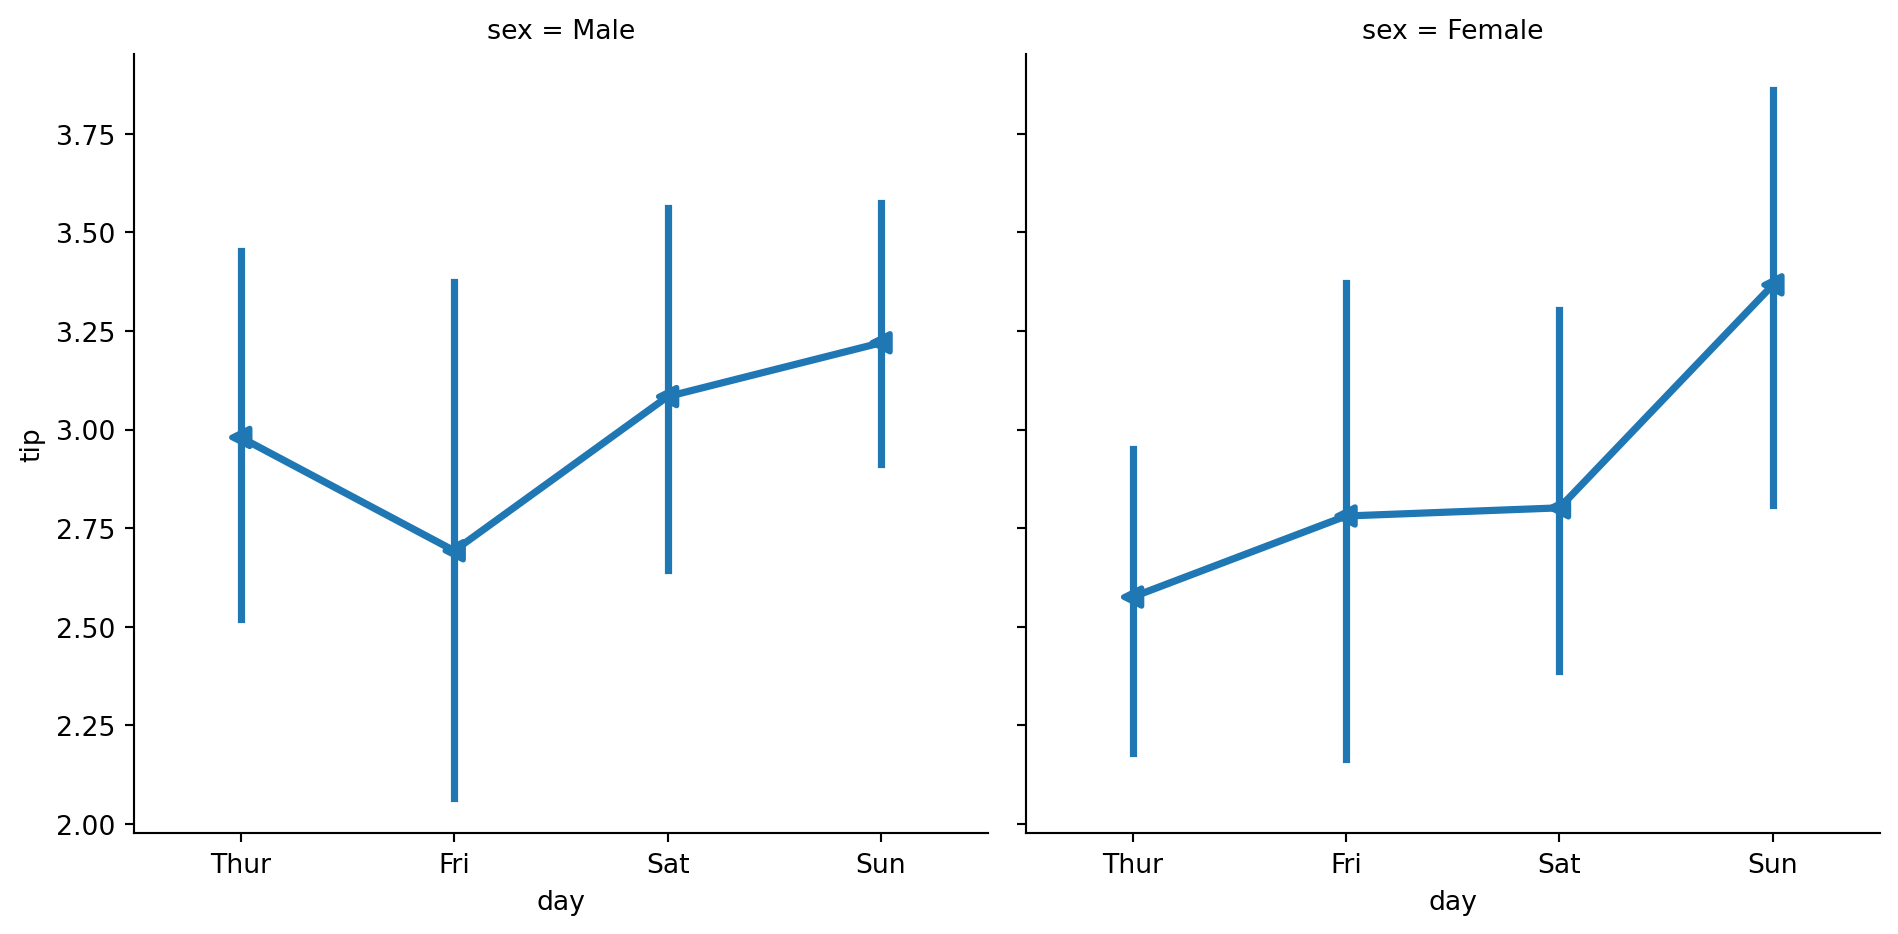
Point plots to emphasize continuity
sns.catplot(data=tips,
            x="day",
            y="tip",
            col="sex",
            kind="point",
            markers='<')